Visualize data
The data visualization of the CMTK is based on Grafana. Grafana allows a multitude of adjustments which are only available here. Detailed information can be found in the Grafana documentation (available online).
General description
The arrangement of the actual value displays and the graphs is generated automatically during commissioning based on the connected sensors and their parameterization. A new visualization, e.g. after connection of other sensors, can be carried out in the settings. The options in the visualization are in English, regardless of the language selection.
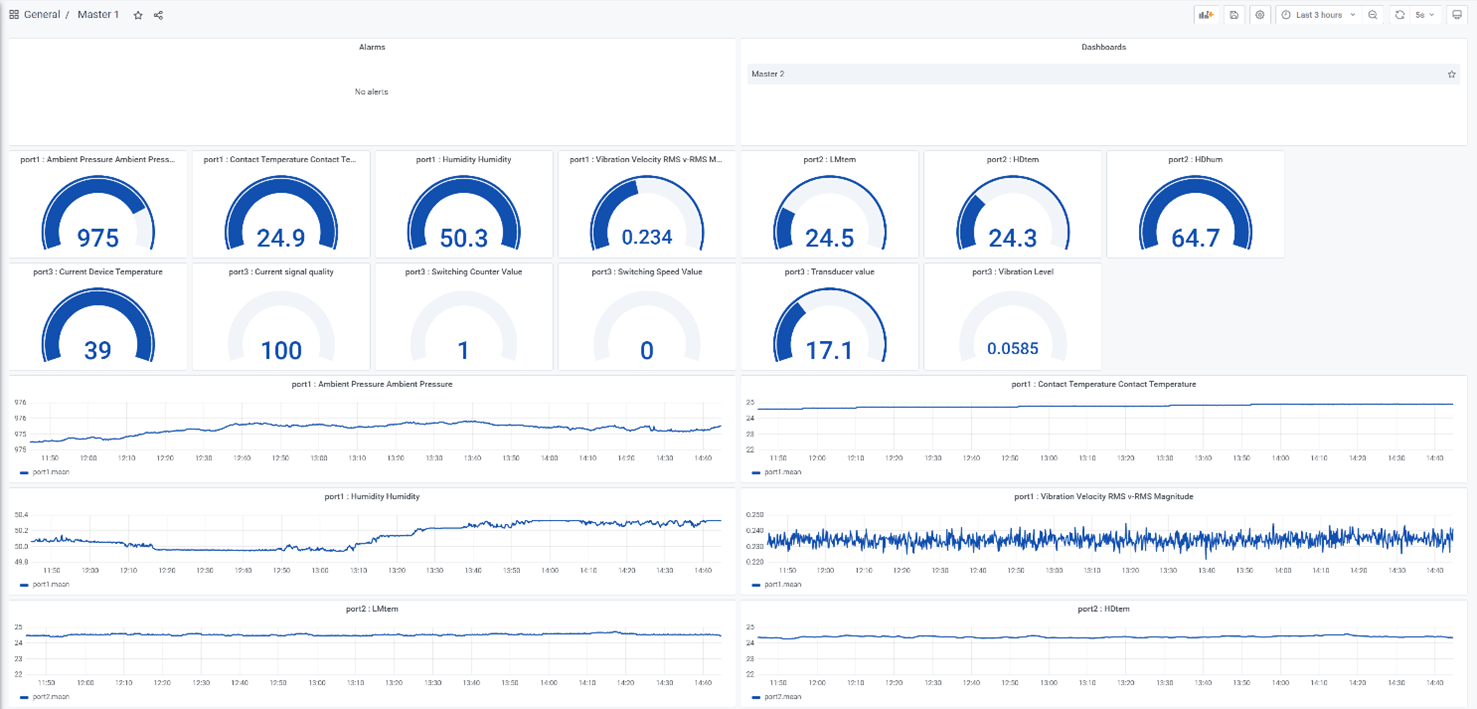
Data Visualization (Grafana)
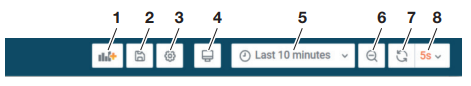
Toolbar (Grafana).
| Pos. | Description |
|---|---|
| 1 | Add diagram |
| 2 | Save settings |
| 3 | Settings |
| 4 | Change view mode |
| 5 | Select time range |
| 6 | Zoom out (Timeline) |
| 7 | Update values and graphs manually (regardless of the update rate) |
| 8 | Update rate |
You can arrange and configure all graphs and displays individually.
- To move a field or display, click and drag the field with the left mouse button to the desired position (other fields may move in the process). The fields cannot overlap.
- To zoom in or out of a field, click and drag the lower right corner with the left mouse button (other fields may move).
- To delete unneeded fields, left-click the down arrow next to the title, select Remove and confirm the selection.
Individual settings
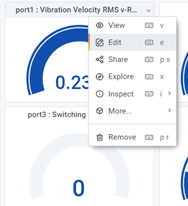
Open configuration screen for a field (actual value display or graphical display)
- Left click on the field header, and click Edit.
Customize names
- Select the Panel tab on the right side.
- Select Settings.
The Settings field will pop up. - Enter a name under Panel title, e.g. Measuring point.
- Click in an area outside the field. The new title is shown.
- Click SAVE in the title bar.
The new settings are saved. - Click APPLY.
The view refreshes and you return to the graphical overview screen.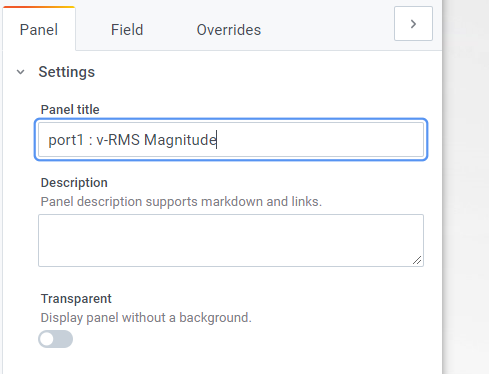
Scale and name axes
- Select the Panel tab on the right side.
- Select Axes.
- Enter the desired values for Y-Min and Y-Max. The new scalings are active.
- Enter an axis name under Label.
- Click SAVE in the title bar to save the new settings.
- Click APPLY.
The view refreshes and you return to the graphical overview screen.
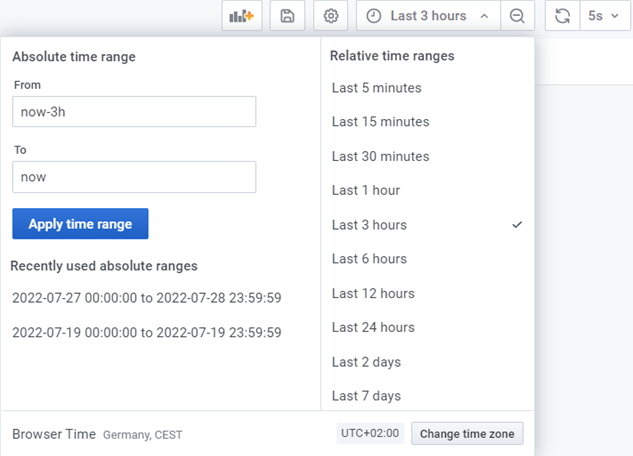
Set time range
-
Click the time range in the toolbar.
-
Select a range from the relative time ranges (Relative time ranges). This view is updated depending on the refresh rate.
Note
At high data rates (e.g. data acquisition every 50 ms) in combination with long time ranges, the display may take a very long time due to large data volumes. In this case the time range should be reduced.
Set up alarm
- Click with the left mouse button on the field header of the graphical display.
- Click Edit.
- Under the graph, select the Alert tab.
-
Click Create Alert.
-
Configure the alarm individually:
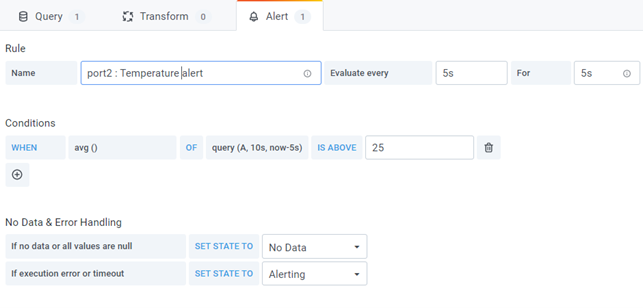
Name: Name of the alarm
Evaluate every: Specifies the time interval at which the alarm should be evaluated.
For: Specifies how long the configured thresholds must be reached or exceeded before the alarm notification is triggered. If a value is entered at For and the query exceeds the configured threshold, the query result changes from OK to Prewarning without sending a notification. If the exceedance lasts longer than the duration entered at For, the query result changes to alarm state and sends notifications. If no value is entered at For, an alarm message and notification are sent immediately.
.
Condition: Specify one or more rules that should result in an alarm being triggered. Various choices are available for this.
Note
In the case of particularly high data rates in combination with short evaluation times, it can happen that individual values are not available in time in the visualization and a no-data event is triggered (the data is nevertheless captured and saved correctly). To avoid this, it is advisable to set a delay of e.g. 5 s both for the evaluation time interval and in the query part of the condition as shown in the example.
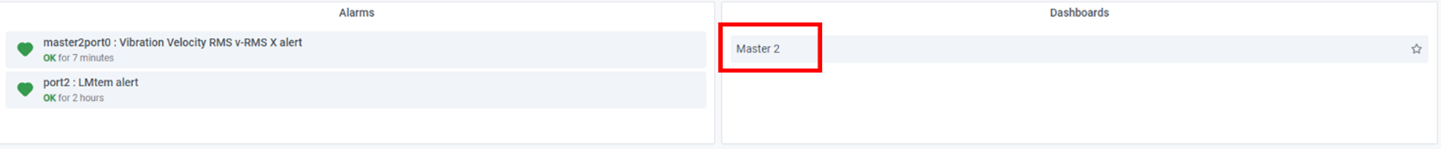
Visualize data from the IO-Link master
- First regenerate the data visualization in the settings to then display the data in the visualization.
A dashboard is generated for CMTK and other for the IO-Link master, inside the dashboards a widget is generated for each of the sensors connected to the CMTK and for the sensors connected to the IO-Link master. - Click on the other device in the selection to switch between the two dashboards within the visualization.