Perform troubleshooting with activity log (LOG)
Jul 24, 2026 | 535 words | 3 min reading time
The log is a tool for detailed troubleshooting in topologies, in which the following events are displayed in their temporal dependence:
Changes to the topology
Changes in the user management
Events that affect the IO-Link network modules or the IO-Link devices.
Search for devices
Import topologies
Firmware updates
The BET collects all events that occur in the logs of the IO-Link network modules present in the topology and displays them. The BET uses the system time of the host computer. The time in the IO-Link network modules is not taken into account. The logs are updated when the topology is updated and when the log is called up (IO-Link network modules must have a green connection status).
Note
The BET automatically reads messages from the IO-Link network modules. As the messages in the IO-Link network modules are only kept in English, the messages are also transferred to the log in English.
Call up log overview for all devices
Click on the Logs tab in the current topology.
The log is displayed:
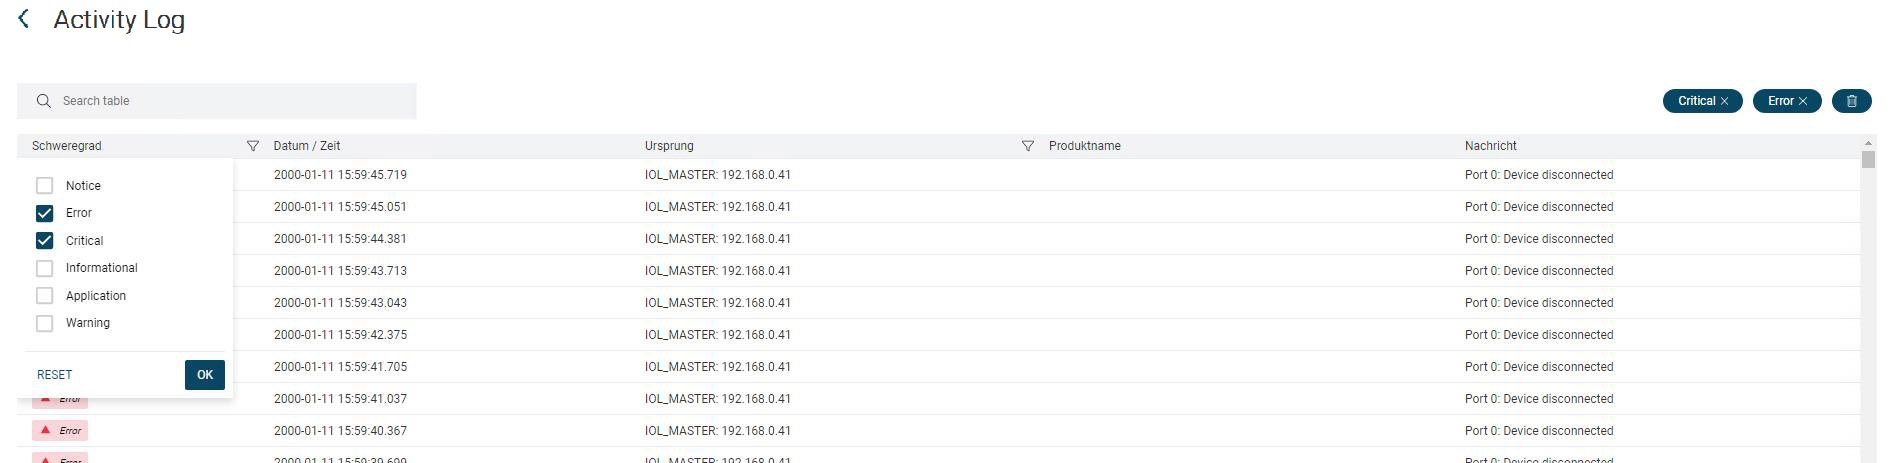
Example of activity log (Log)
Note
Click on the question mark on the right-hand side to find a different way of displaying certain events.

In the log overview you will find the following information:
Severity
Each event is assigned a severity level from eight categories (sorted in descending order).
Severity |
Description |
|---|---|
1. Emergency |
Internal error |
2. Error |
External fault |
3. Warning |
The IO-Link network module or the IO-Link device has detected an event that requires your attention, but no intervention is necessary yet. |
4. Notice |
The IO-Link network module or the IO-Link device has detected an operating event. This includes, for example, detected firmware version and start of a device or detected IP and gateway addresses |
5. Informational |
Event |
6. Debug |
Messages that mainly concern administrators and can be helpful for troubleshooting. |
Event source
Indicates the source of the entry, for example the IO-Link device. The source is the point of origin of the action.
Date
Time of occurrence and date of the event stored in the log.
Format of the timestamp: date - time (incl. milliseconds)
Note
When the log data is first read in from the IO-Link network modules, the time of the read-out is adopted as the time for the events. This can lead to events that occurred earlier in the IO-Link network module being transferred to the log with the same time. From the time at which the BET was switched on, an event is entered with the time stamp.
Event code
If available, the code for the event is specified here, which could be helpful for error handling.
**Error message
Content of the login entry.
Call up log overview for specific devices
In the topology, select the devices for which you want to display the log.
Click on the Event logs tab. If you are already in the Logs view, click on the desired device.
The log for the selected devices is displayed.
If required, sort the displayed entries by clicking on the respective column headings.
Export logs
If you are in the Logs view, select the entries you want to export by clicking on them.
Marked events are displayed.
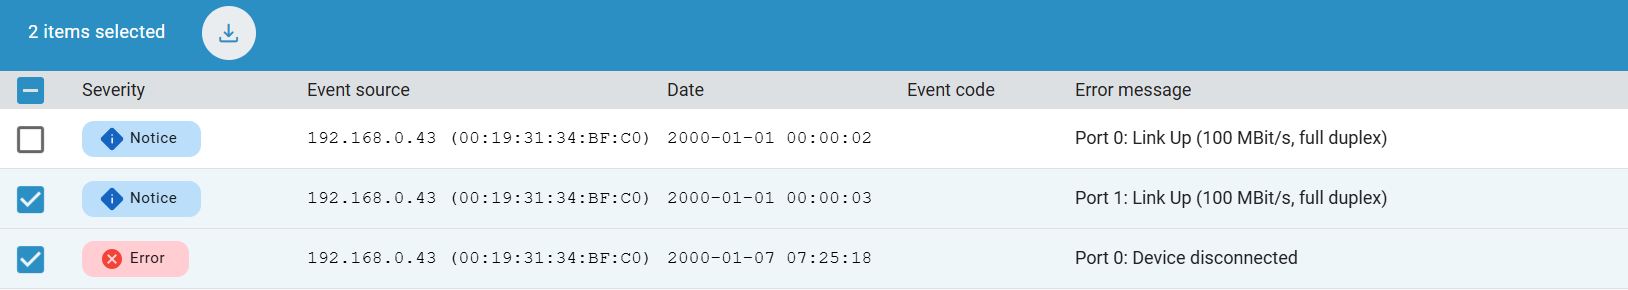
Click Export.

You will be prompted to save the file to the file system.
Choose a location, assign a file name, and click Save.