Image Data & Interpretation#
The RadarImager receives radar waves that have been reflected by the target object. From these measured signals, the reconstruction algorithm generates a complex radar image that contains both amplitude and phase information.
This data can be displayed in different ways. In the software, you can select a magnitude (absolute) view, a phase view, or a combination of both. Each representation emphasizes different aspects of the measurement and therefore supports different interpretation tasks.
Magnitude (absolute) view#
The magnitude view shows the strength, or amplitude, of the waves returned from the target object. In the image, this information is displayed as brightness:
- Bright areas: Strong reflection (high amplitude)
- Dark areas: Weak (or no) reflection (low amplitude)
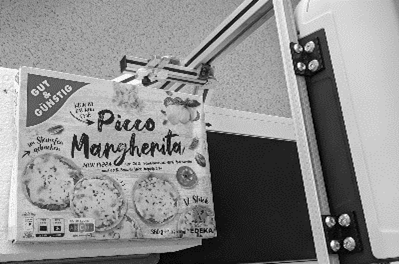
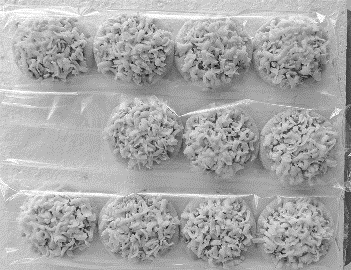
In this example, the carton base below the mini pizzas appears brighter than the pizzas themselves. This means that the carton base produces a stronger reflection, while the pizzas reflect only weakly, or barely at all.
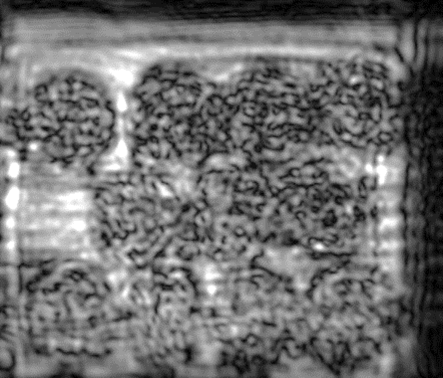
The bright carton base is clearly visible in the magnitude image because it reflects more strongly than the pizzas.
Phase view#
The phase view is usually combined with magnitude information as brightness, because phase is mainly relevant where reflections are already present. It provides fine distance information within a single layer image and can resolve differences within the wavelength range of approximately 2 mm.
In simple terms, phase can make very small distance differences visible. For example, if two structures are almost the same size, the phase display can reveal which one is slightly closer to the radar. Using a color map, these small height differences become visible as color changes.
However, phase is not influenced by distance alone. It is also affected by the strength of the reflection and by the transparency properties of dielectric materials.
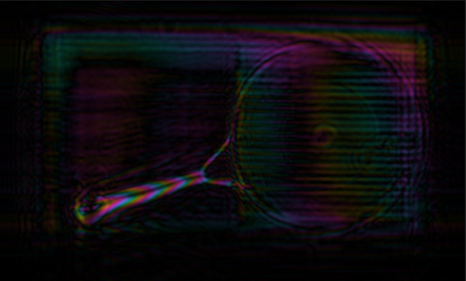
The colors repeat approximately every phase cycle of 2π, which corresponds to a distance of around 2 mm in the range direction. This can be seen on the slanted pan handle.
In practice, the phase view is used to detect very small position changes, surface variations, or material-dependent signatures. Its usefulness always depends on the actual target and application, because distance effects and material effects can overlap and can no longer be separated reliably during evaluation.
The current phase color map can be interpreted as roughly six color regions.

For pure distance interpretation, two adjacent colors, for example red to purple or blue to green, correspond to a height difference of approximately 2 mm / 6 = 0.33 mm. However, this should not be used as a quantitative measurement method. It is intended for qualitative interpretation only.
Uneven surfaces, which are common for cardboard and thin plastics due to surface tension, can also change the displayed color. For this reason, height comparisons based on phase should ideally be performed directly on the object, without packaging, and on surfaces that are as even as possible.
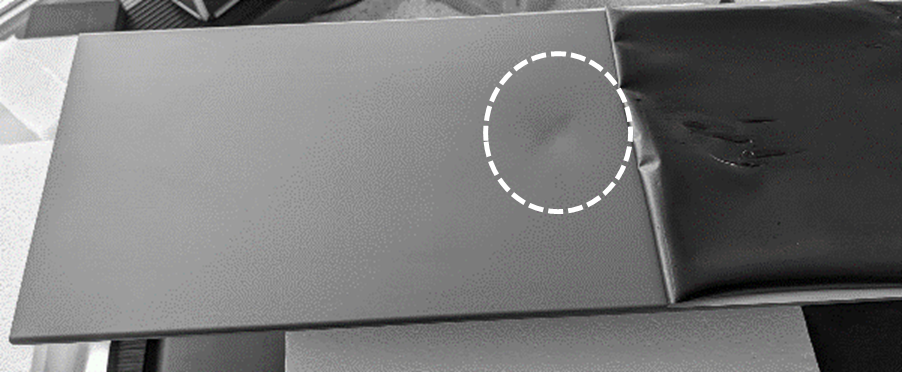
The marked bump creates a local height difference relative to the surrounding metal plate.
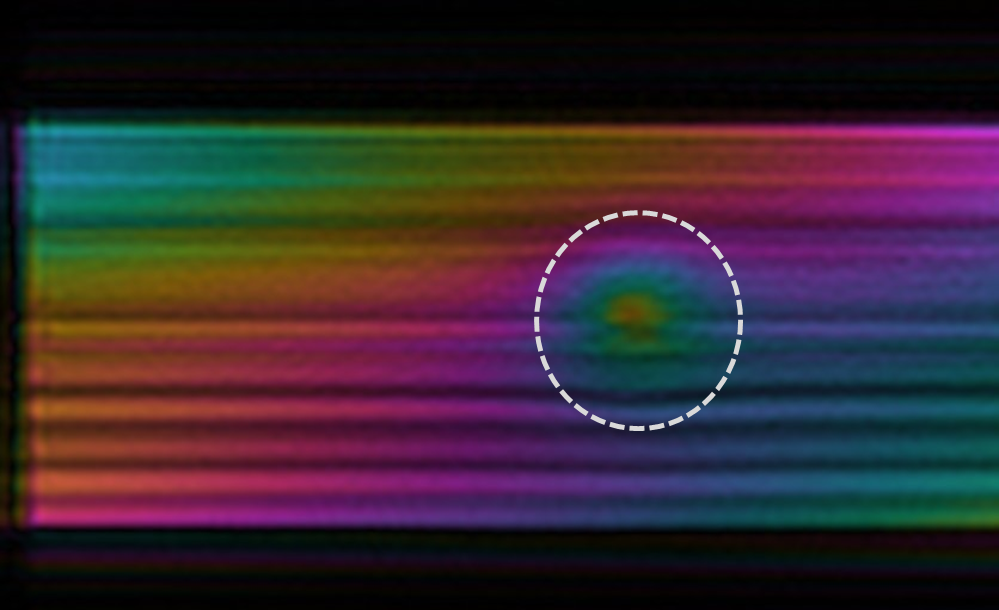
The color differs from the surrounding area because the bump is slightly farther away from the RadarImager than the metal plate itself. In addition, the bump introduces a structural change that appears as a circular pattern in the phase image. The phase on the metal plate itself shows a smooth, uniform gradient because the metal plate is not aligned exactly parallel to the RadarImager.
Summary of the view variants#
- Magnitude view: Easier to interpret and useful for understanding reflectivity and general object structure.
- Phase view: More sensitive to small distance differences and material-dependent effects, and therefore useful for specialized evaluation tasks.